Spaghetti chart and warehouse operations
Illustrating workflows using a spaghetti chart can improve the efficiency of factories and warehouses.
What is a spaghetti chart and what is its purpose?
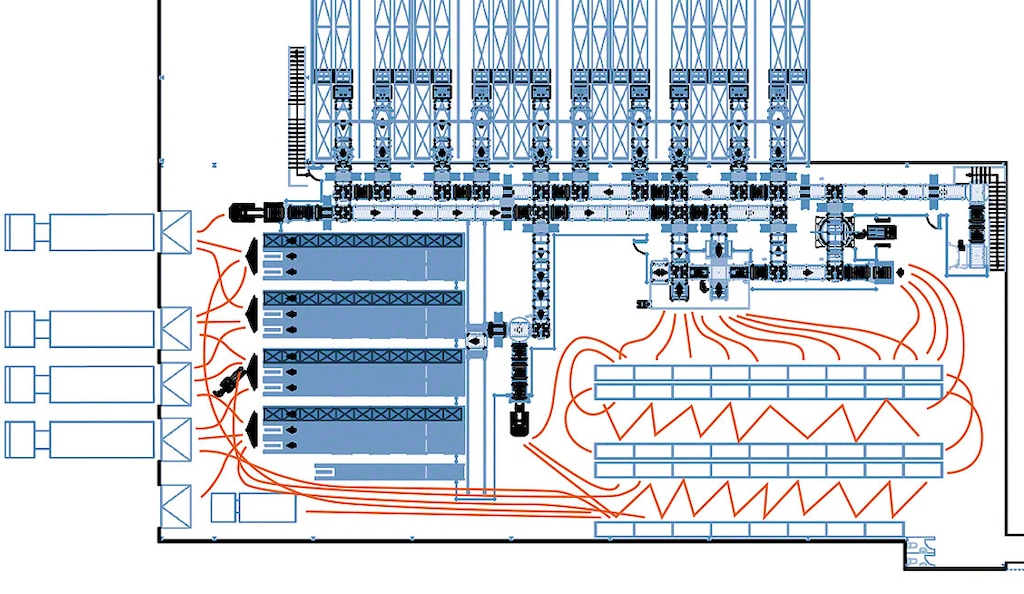
A spaghetti chart is a drawing used to represent or map out production or distribution processes and their subsequent analysis. This visualization tool consists of a series of lines that reproduce the movement of people, products in the manufacturing phase, or goods that need to be prepared for shipment. Studying these routes allows organizations to identify any delays, bottlenecks, or other incidents that are slowing down productivity and helps them implement measures to correct these problems. The spaghetti diagram is a valuable tool for implementing lean logistics strategies, aimed at detecting and eliminating non-value-adding activities.
Why should companies use the spaghetti flowchart?
These charts can be especially helpful when evaluating movements in environments where people or machines perform repetitive or very similar tasks. Some examples include assembly lines or moving items from point A to point B, but they can also extend to tracking routes in settings like offices. Apart from physical spaces, spaghetti charts are used in fields such as website design to plan the flow of pages.
How is the spaghetti chart applied in logistics?
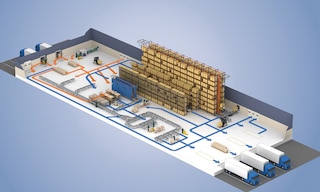
The design of a distribution center or warehouse plays a crucial role in the efficiency of the flow of goods within it and their subsequent shipment. Storage experts leverage spaghetti charts to create the initial layout of a facility prior to its commissioning and reorganize these spaces once operations have grown and needs have evolved.

Benefits of the spaghetti chart
Devoting resources to creating a spaghetti chart or entrusting this analysis to logistics experts brings multiple advantages:
- Identification of inefficiencies. The simplicity of these drawings, in which routes are illustrated by strands resembling pasta, makes it easier to detect organizational obstacles and work towards operational excellence.
- Calculation of time spent. If performed correctly and including all the movements completed by a person or goods, the spaghetti chart can identify how many hours are wasted in poorly optimized processes and quantify the extent of the problem.
- Task coordination. In addition to correcting possible inefficiencies, these charts enable businesses to visually monitor the work of a department and aid in training new team members.
- Improving productivity. Visualizing all the flows that occur in a shift in a single diagram offers a real understanding of what happens in a production center, warehouse, or manufacturing environment.
How is a spaghetti chart made?
The first step in creating a spaghetti chart is to have a facilities map. This should include elements such as goods-in/goods-out points, racking, loading docks, and conveyors. This graphical representation can be drawn by hand, but it will be more legible and clearer if generated using warehouse simulation software or a similar program.
After observing the operation of the production center or warehouse, lines are drawn to represent the actual flow of people or items on the map. The final illustration can be made clearer by using different colors to distinguish between people and machines such as forklifts, pallet trucks, or autonomous mobile robots (AMRs). Likewise, the spaghetti chart needs to incorporate operations related to the receipt of goods, their slotting within the warehouse, and the picking and packing processes they will undergo later. Once the spaghetti chart is complete, it’s a good idea to pay attention to these aspects to implement improvements:
- The routes and their objectives. The drawing shows the paths that workers or goods follow in the facility. This makes it possible to determine which tasks require more resources and identify inefficient processes that involve unnecessary travel.
- Congestion areas. This tool helps locate high-traffic areas and analyze their causes. The aisles may be too narrow or the warehouse may be poorly laid out, but these issues are easily addressed by storage experts like those at Interlake Mecalux. Moreover, making modifications will improve worker safety and ensure the proper preservation of goods.
One of the most agile ways to improve these processes is to implement a warehouse management system (WMS). These programs intervene in all operations: receiving, slotting assignment, order fulfillment, and shipping, thus guaranteeing product traceability.
Spaghetti diagram example

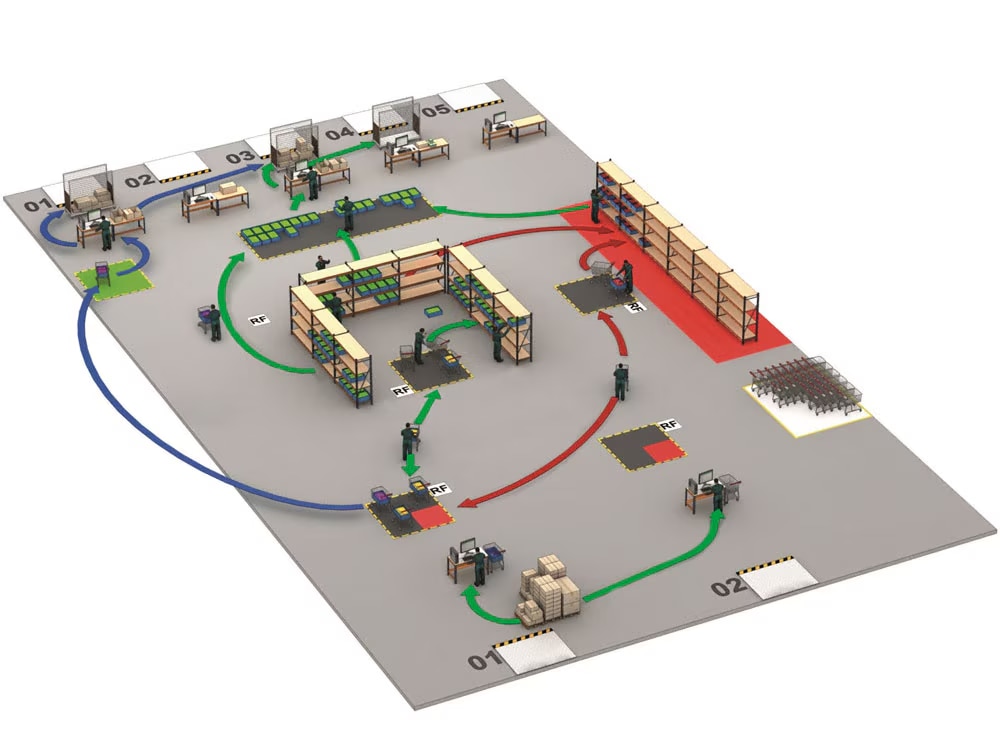
Spaghetti charts can be used to represent different types of movements of workers, goods, and operations. For example, the graphic above illustrates a warehouse that follows a cross-docking strategy.
The blue lines describe the route taken by packages that have been shipped directly. Products that follow the green path are directed to the central area of the map, where orders that include more than one stock line are picked. Finally, the red strands indicate the route of the shipments in which some kind of incident has occurred. These are temporarily placed on the racks to the right until the missing item is available; they then return to the starting point to follow the blue or green route.
Improve your warehouse routes with Interlake Mecalux
If you’re looking to gain full control over your facilities and inventory, at Interlake Mecalux, we can help. Our Easy WMS software increases the throughput of manual and automated storage systems, and hundreds of customers use it every day to optimize their operations. Contact us for advice on this and other storage and process control solutions.
